Morph Chart
Tags: think, innovate, and designPersonhours: 3
Task: Create a morph chart to analyze all our designs so far in this season.
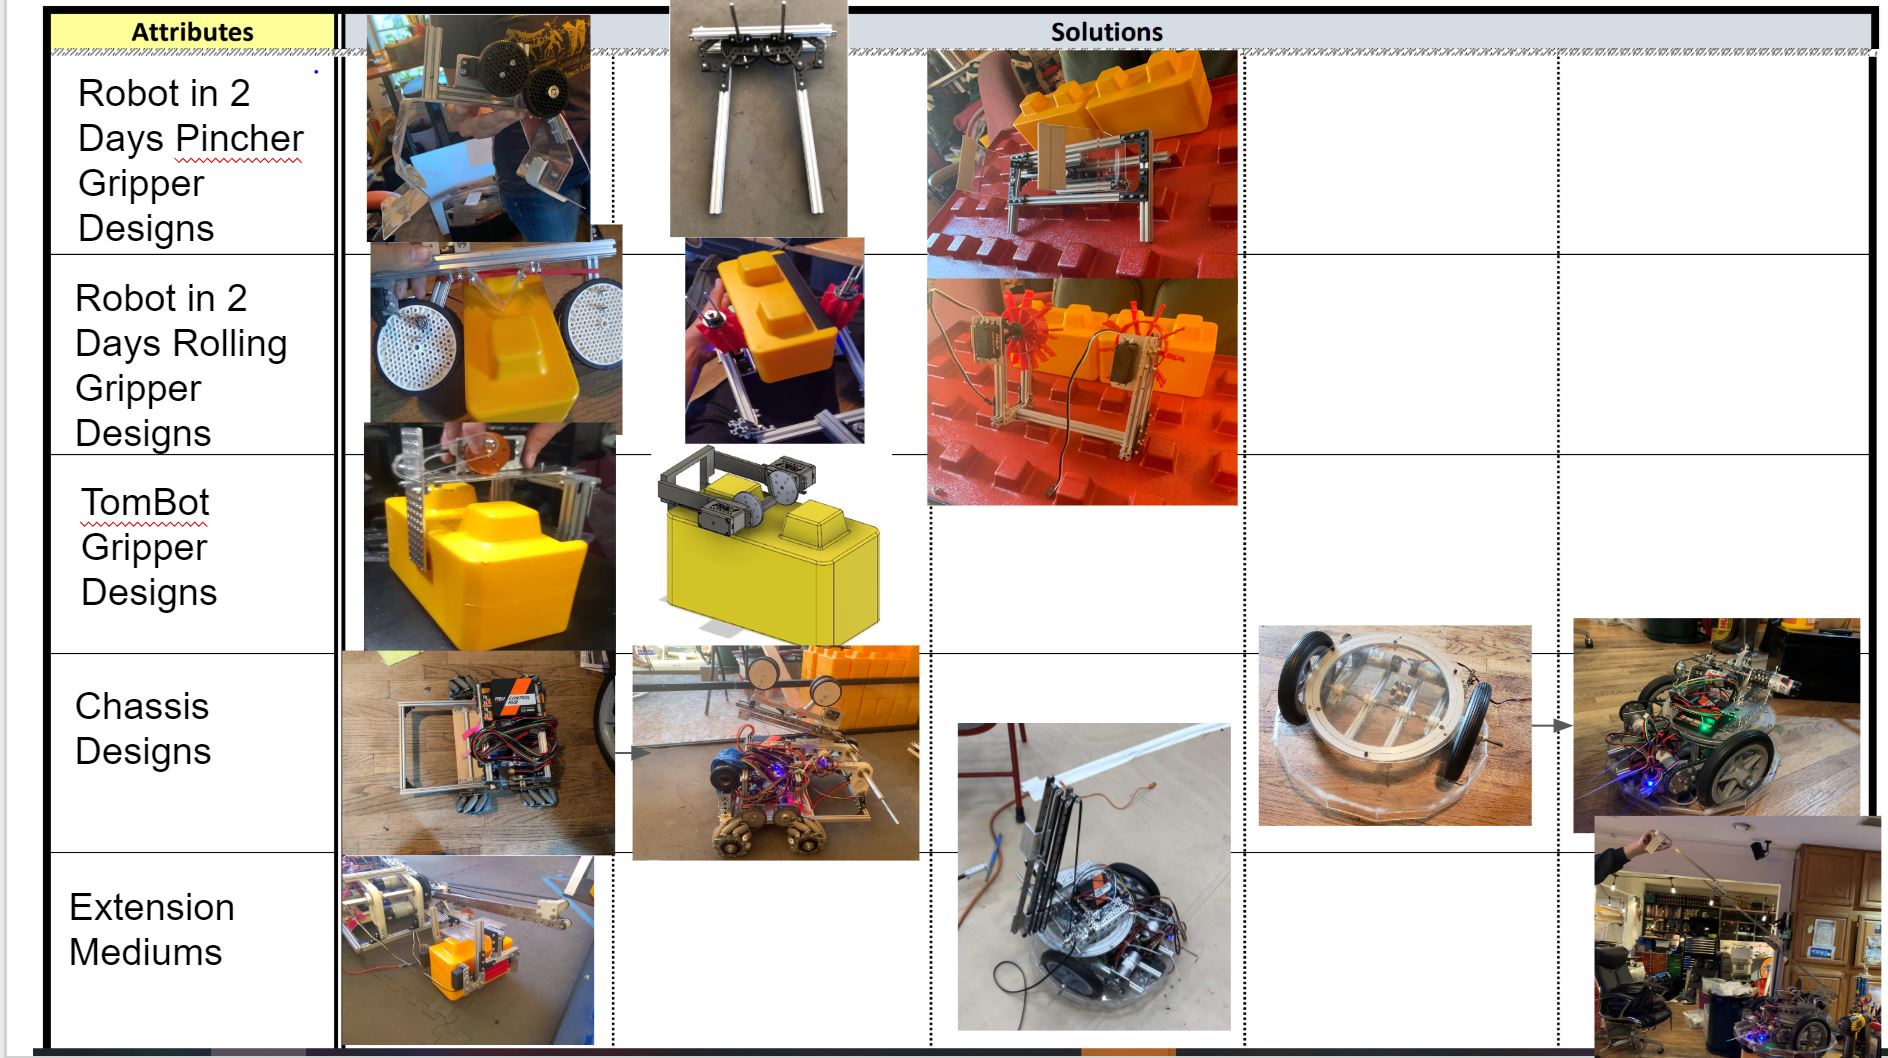
Iron Reign has seen several iterations of several subsystems over this past build season. With our first qualifier being 2 days away, its finally time to come full circle and identify the different iterations of different subsystems coming together. To do this, our team used a morph chart. A morph chart shows the various subsystems of our 2 robots in this system - our robot in 2 days bot Frankendroid and our competition bot TomBot.
The left axis showcases the different subsystems like gripper designs for both robots, chassis designs and progressions, and extension mediums. A morph chart is often used by professional engineers to document the cyclical nature of choosing and moving through various designs. So far, Iron Reign has been through 9 types of gripper designs, 2 chassis designs, 2 linear slides systems differing in lengths and a third one incorporating the logarithmic spiral described in an earlier post.
Across each row, alternative designs for each subsystem have also been depicted. As of now, our current robot has a circular chassis as shown in the second design in the fourth row, a flat gripper system as depicted in the first column of the third row, and a linear slide system supported by a logarithmic spiral in the fifth column of the fifth row.
Next Steps
Placing all of our designs in one chart like this allows us to see how iterative our design process has been, and how much of an influence each design has had on another. With all of our designs so far placed in the morph chart, our next step is to continue to update the chart after our first qualifier so that we can have a pictorial summary of our entire build season for reference.