
Flyset Workshop Vision Presentation
Tags: controlPersonhours: 2
Task: Deliver a Presentation Over Developing Vision Pipelines At The Flyset Workshop
This Saturday, we had the oppurtunity to present at the Flyset workshop, an event in which multiple teams could present a topic of their choosing, such as (but not limited to) build, design, and programming. For one of our two presentations, we decided to share our process for rapidly prototyping and testing OpenCV vision pipelines, taking a drag-and-drop visual pipeline in GRIP to a fully-fledged working android project that can be deployed to a control/expansion hub.
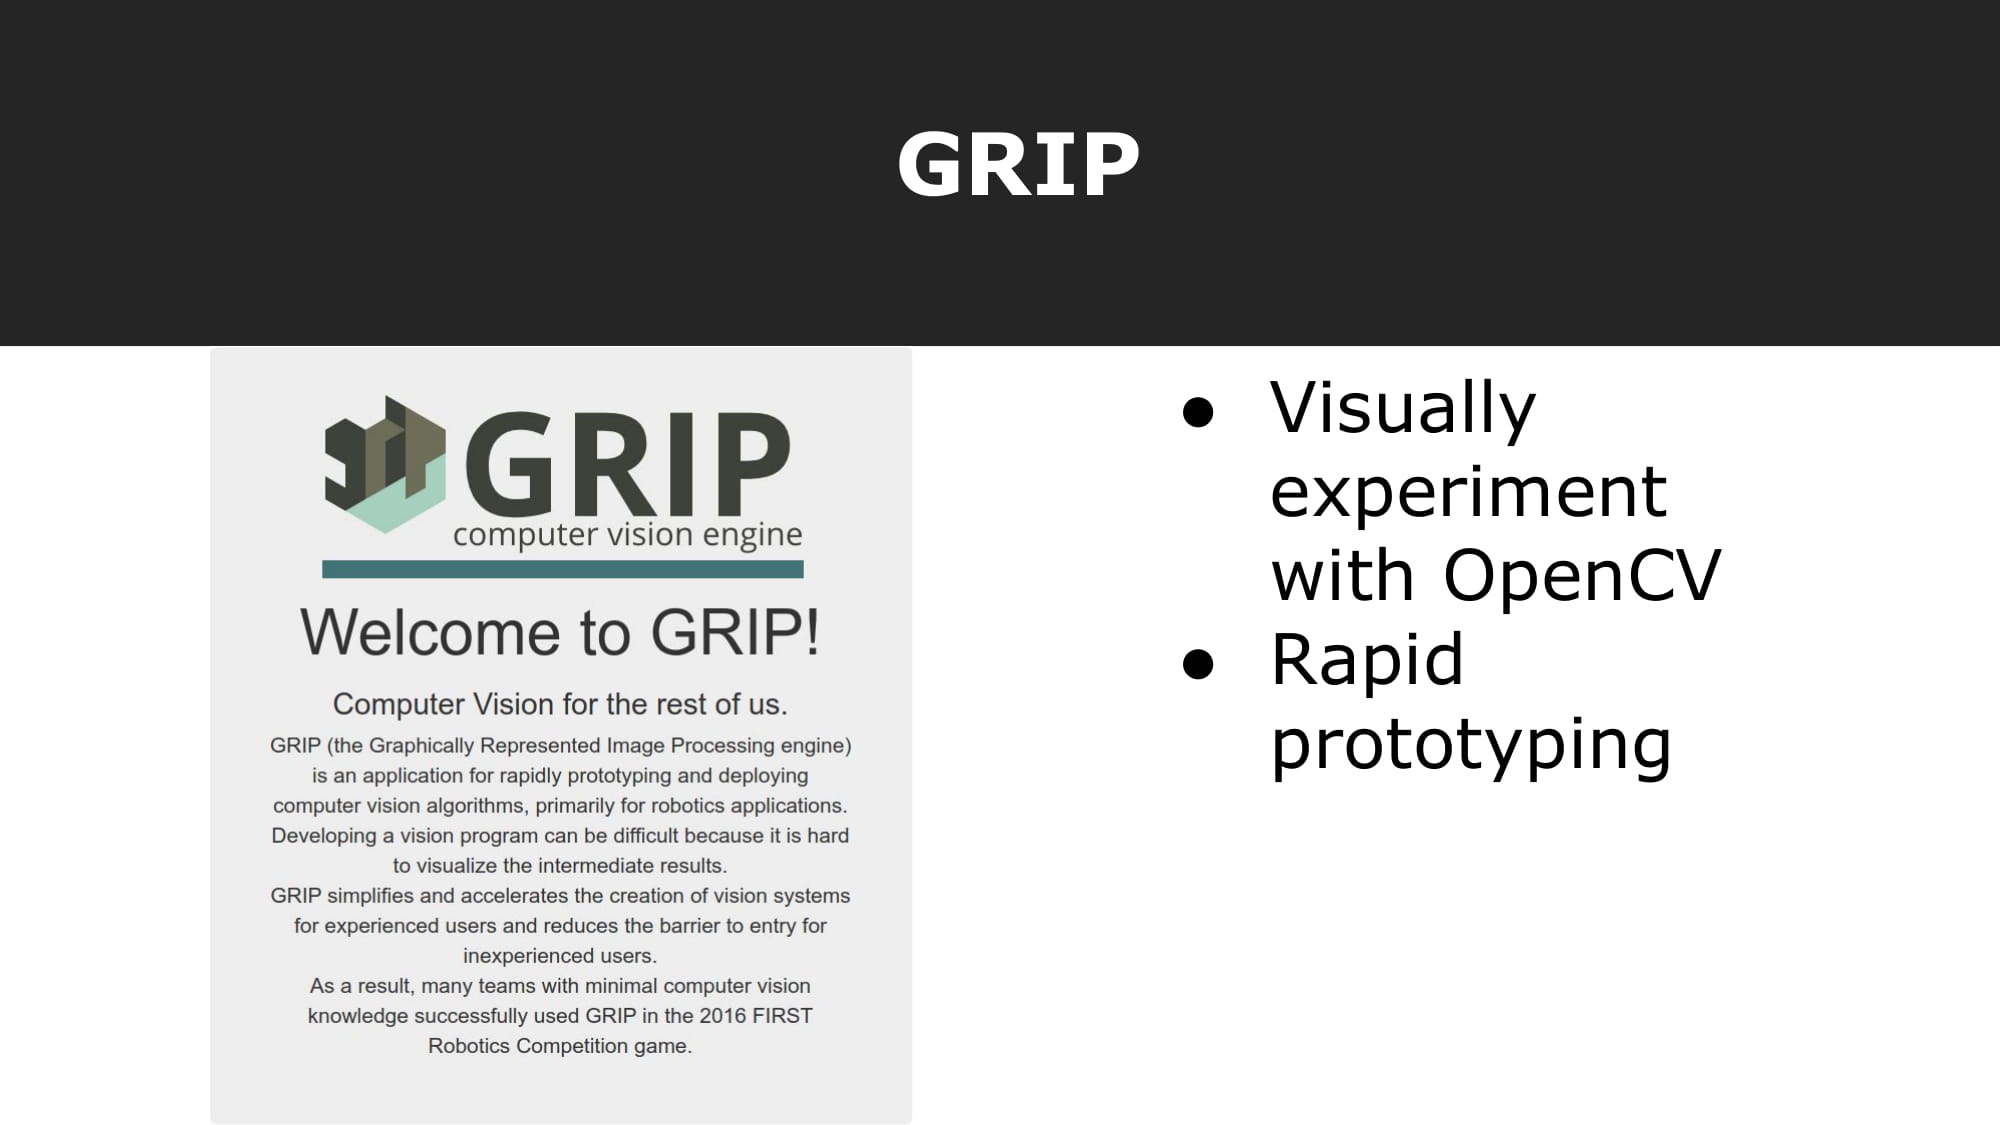
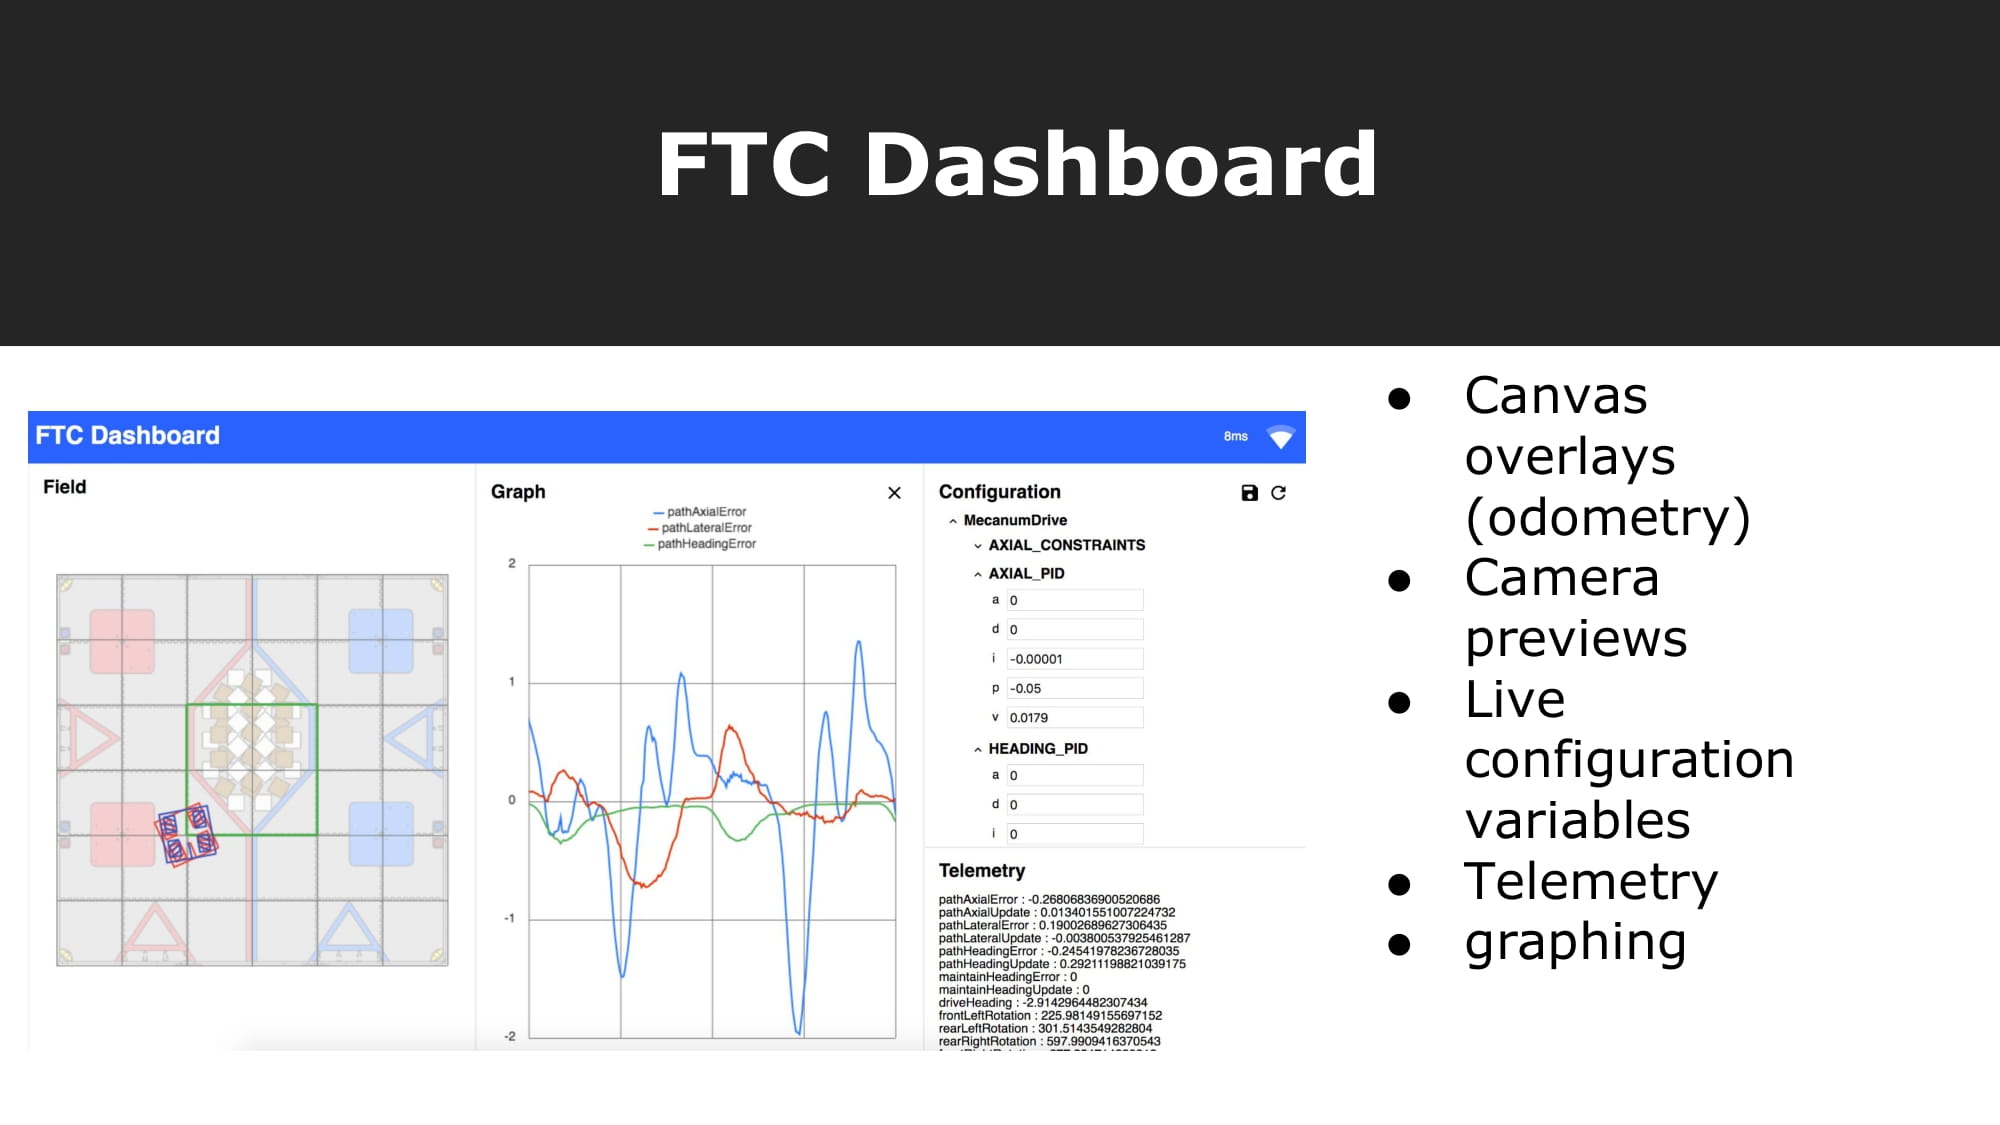
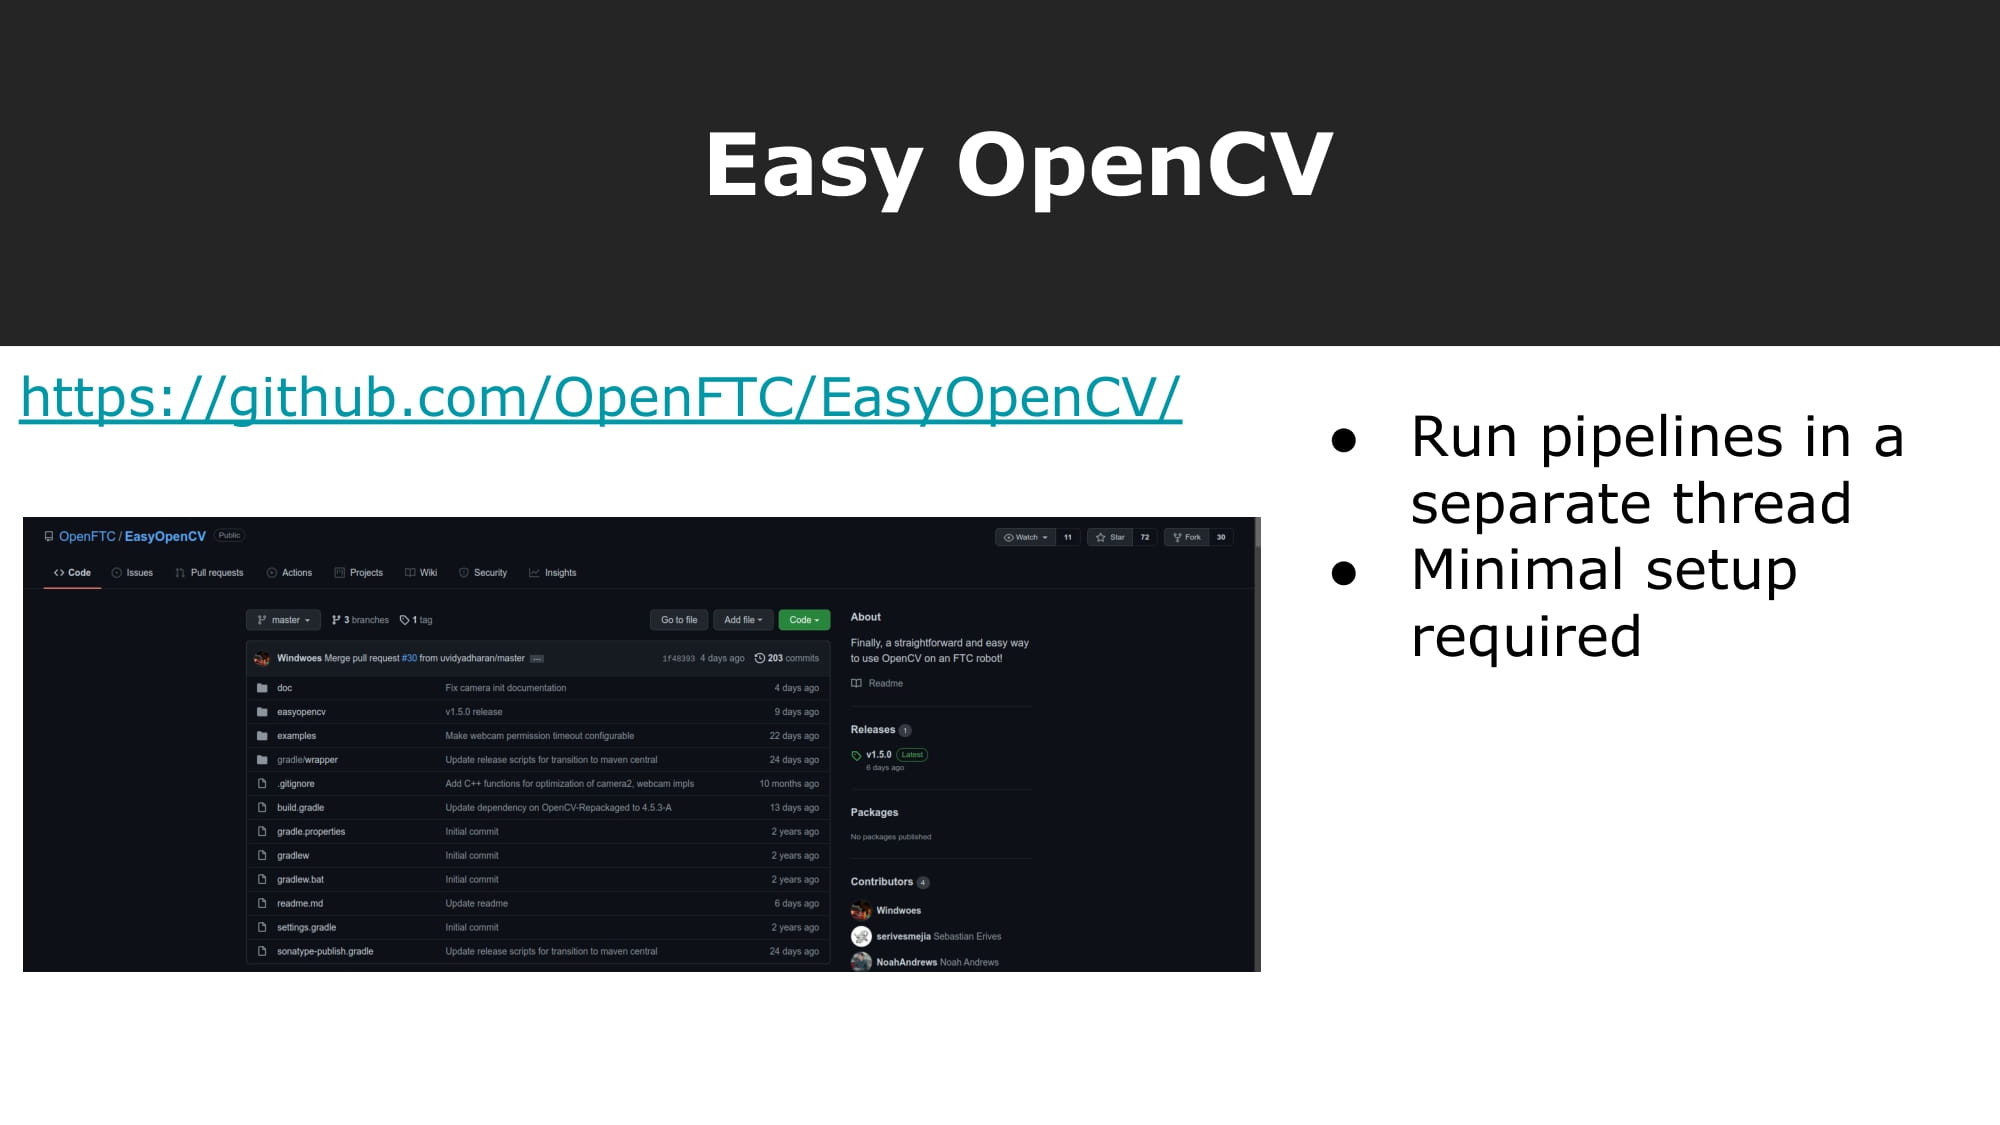
To begin the presentation, we introduced the programs and dependencies we use for developing vision pipelines. These include GRIP (a graphical tool to easily visualize and test out different computer vision pipelines), FTC Dashboard (a project dependency that allows for remote debugging with image previews, on-the-fly variable editing, live telemetry, graphing, and a field overlay), and EasyOpenCV (a project dependency that simplifies using OpenCV for FTC and runs vision pipelines in a separate thread for maximum efficiency).
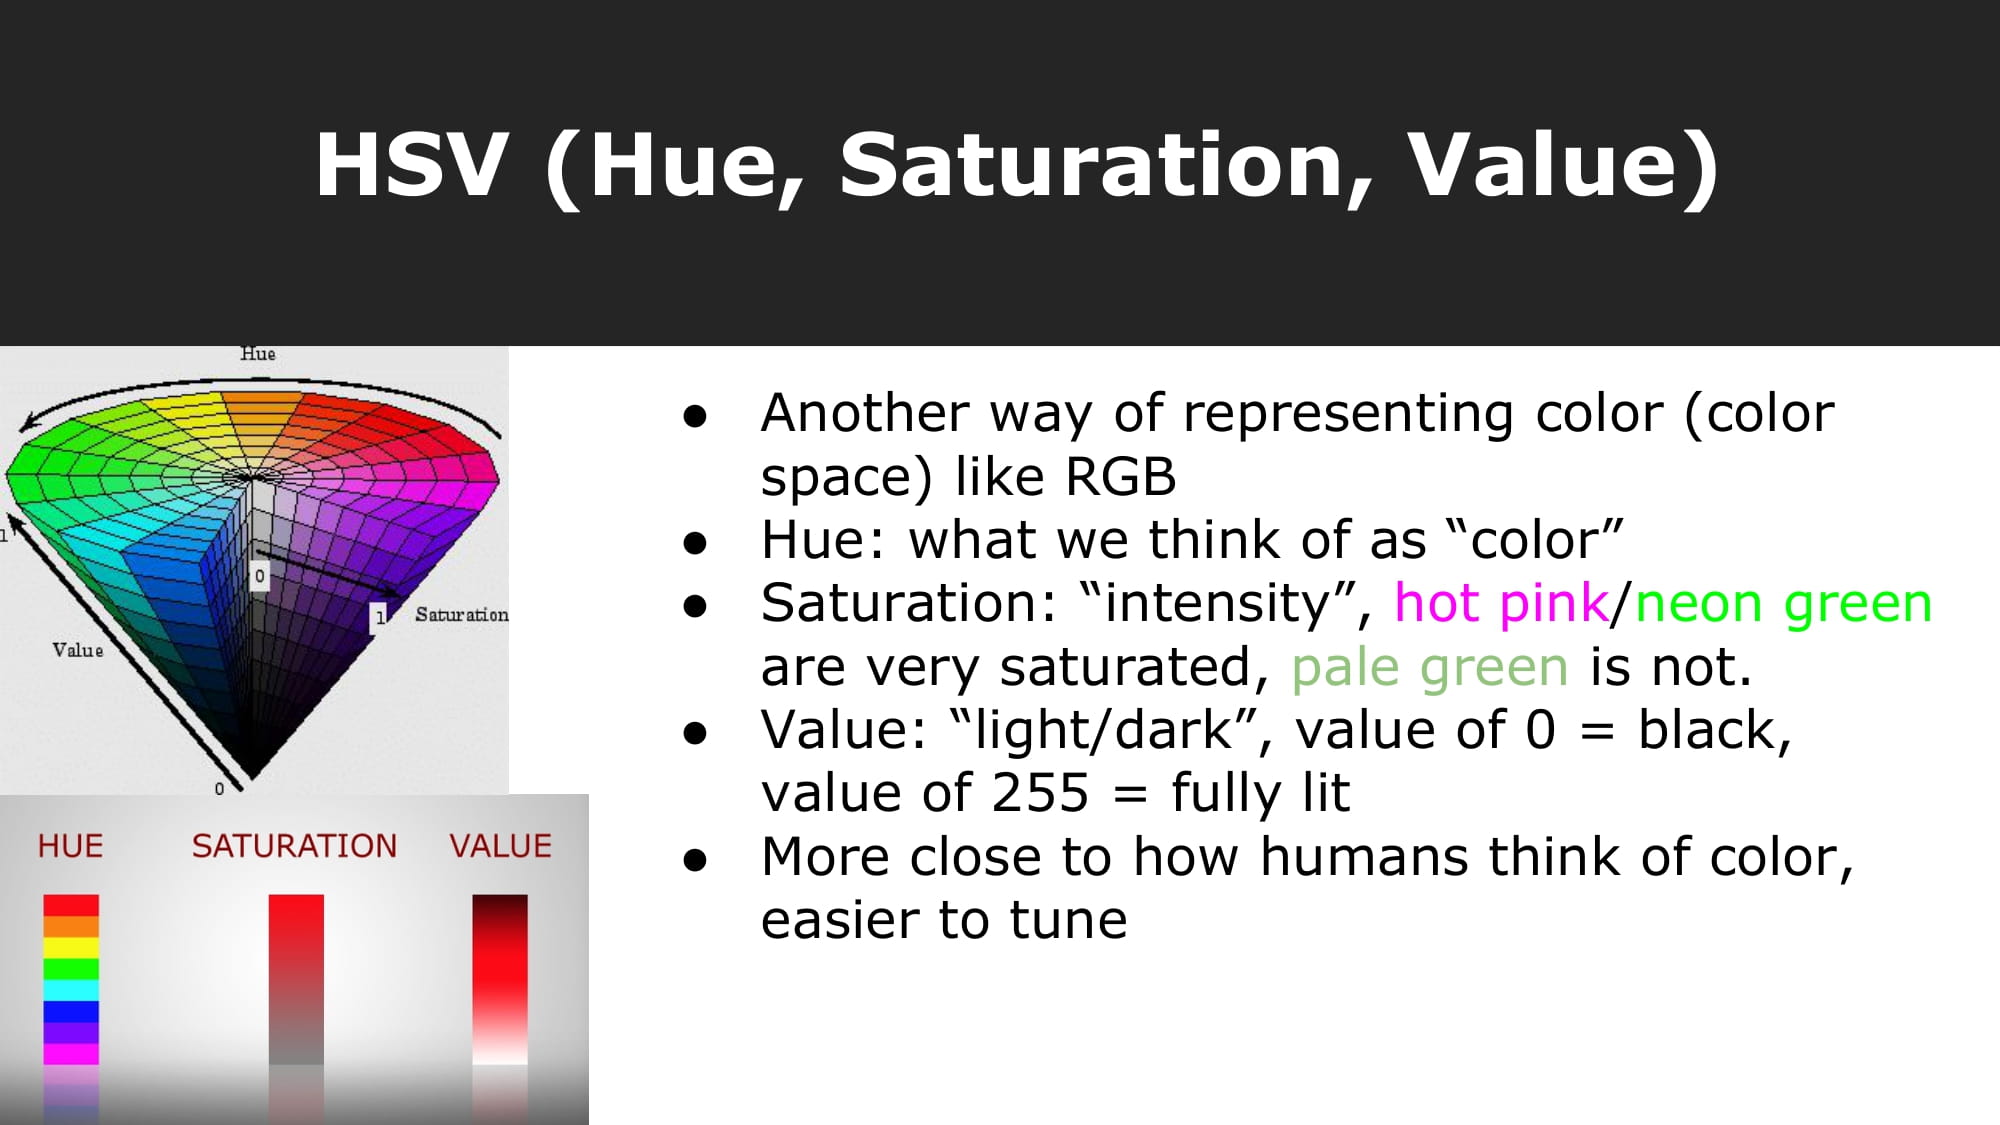
Next, we laid the foundation for the HSV threshold step to come by introducing the audience to the HSV color space and its advantages that make it easier to tune for the purposes of sampling an orange cone or colored team marker. We then transitioned (not shown in slides) to the concept of an HSV threshold, which takes an rgb image and uses hue, saturation, and value ranges to let only certain pixels through the threshold, ultimately producing a binary image.
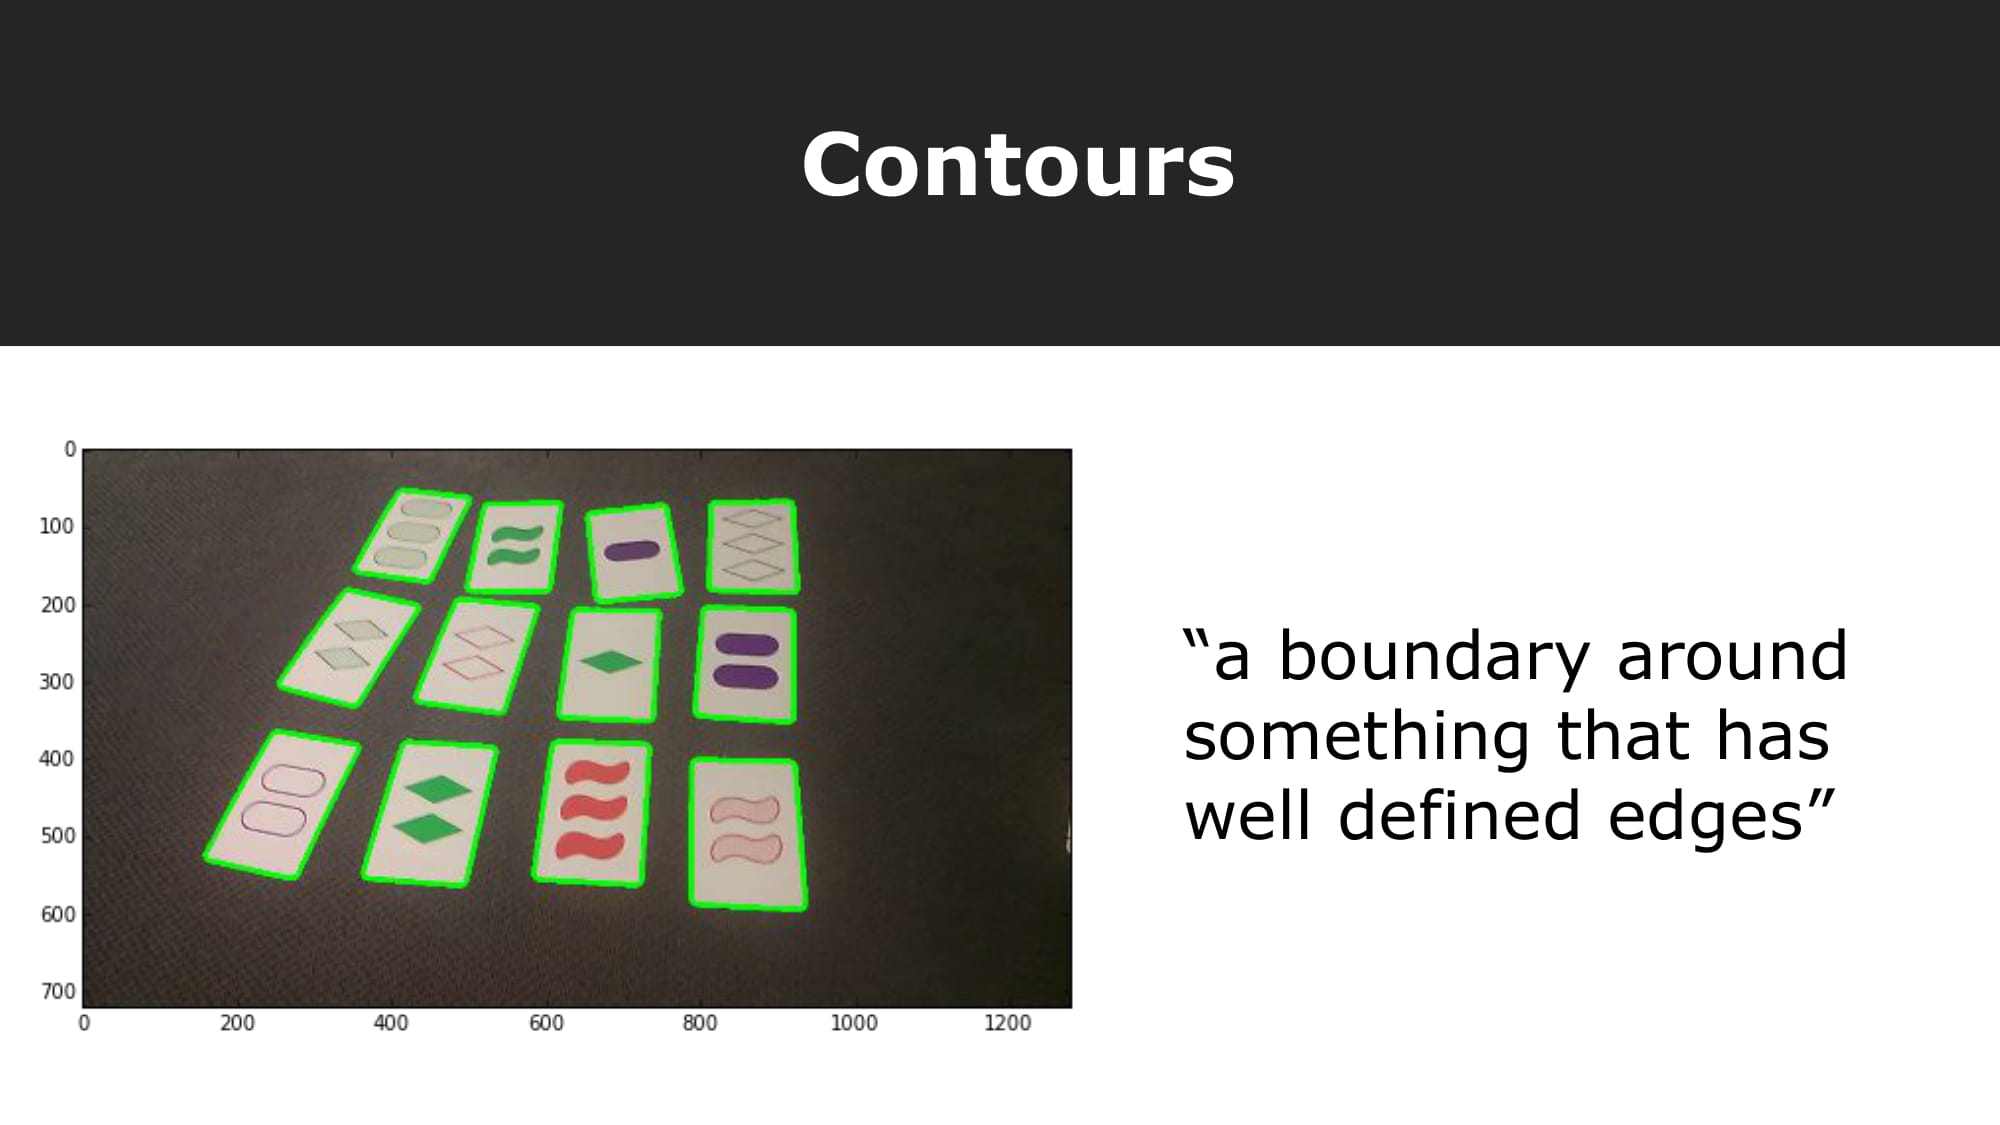
The final requirement for understanding our color-based detection approach is that of contours in the context of computer vision. We explained the definition of contours (boundaries that enclosed shapes or forms in an image), and how they can be detected from thresholded images.
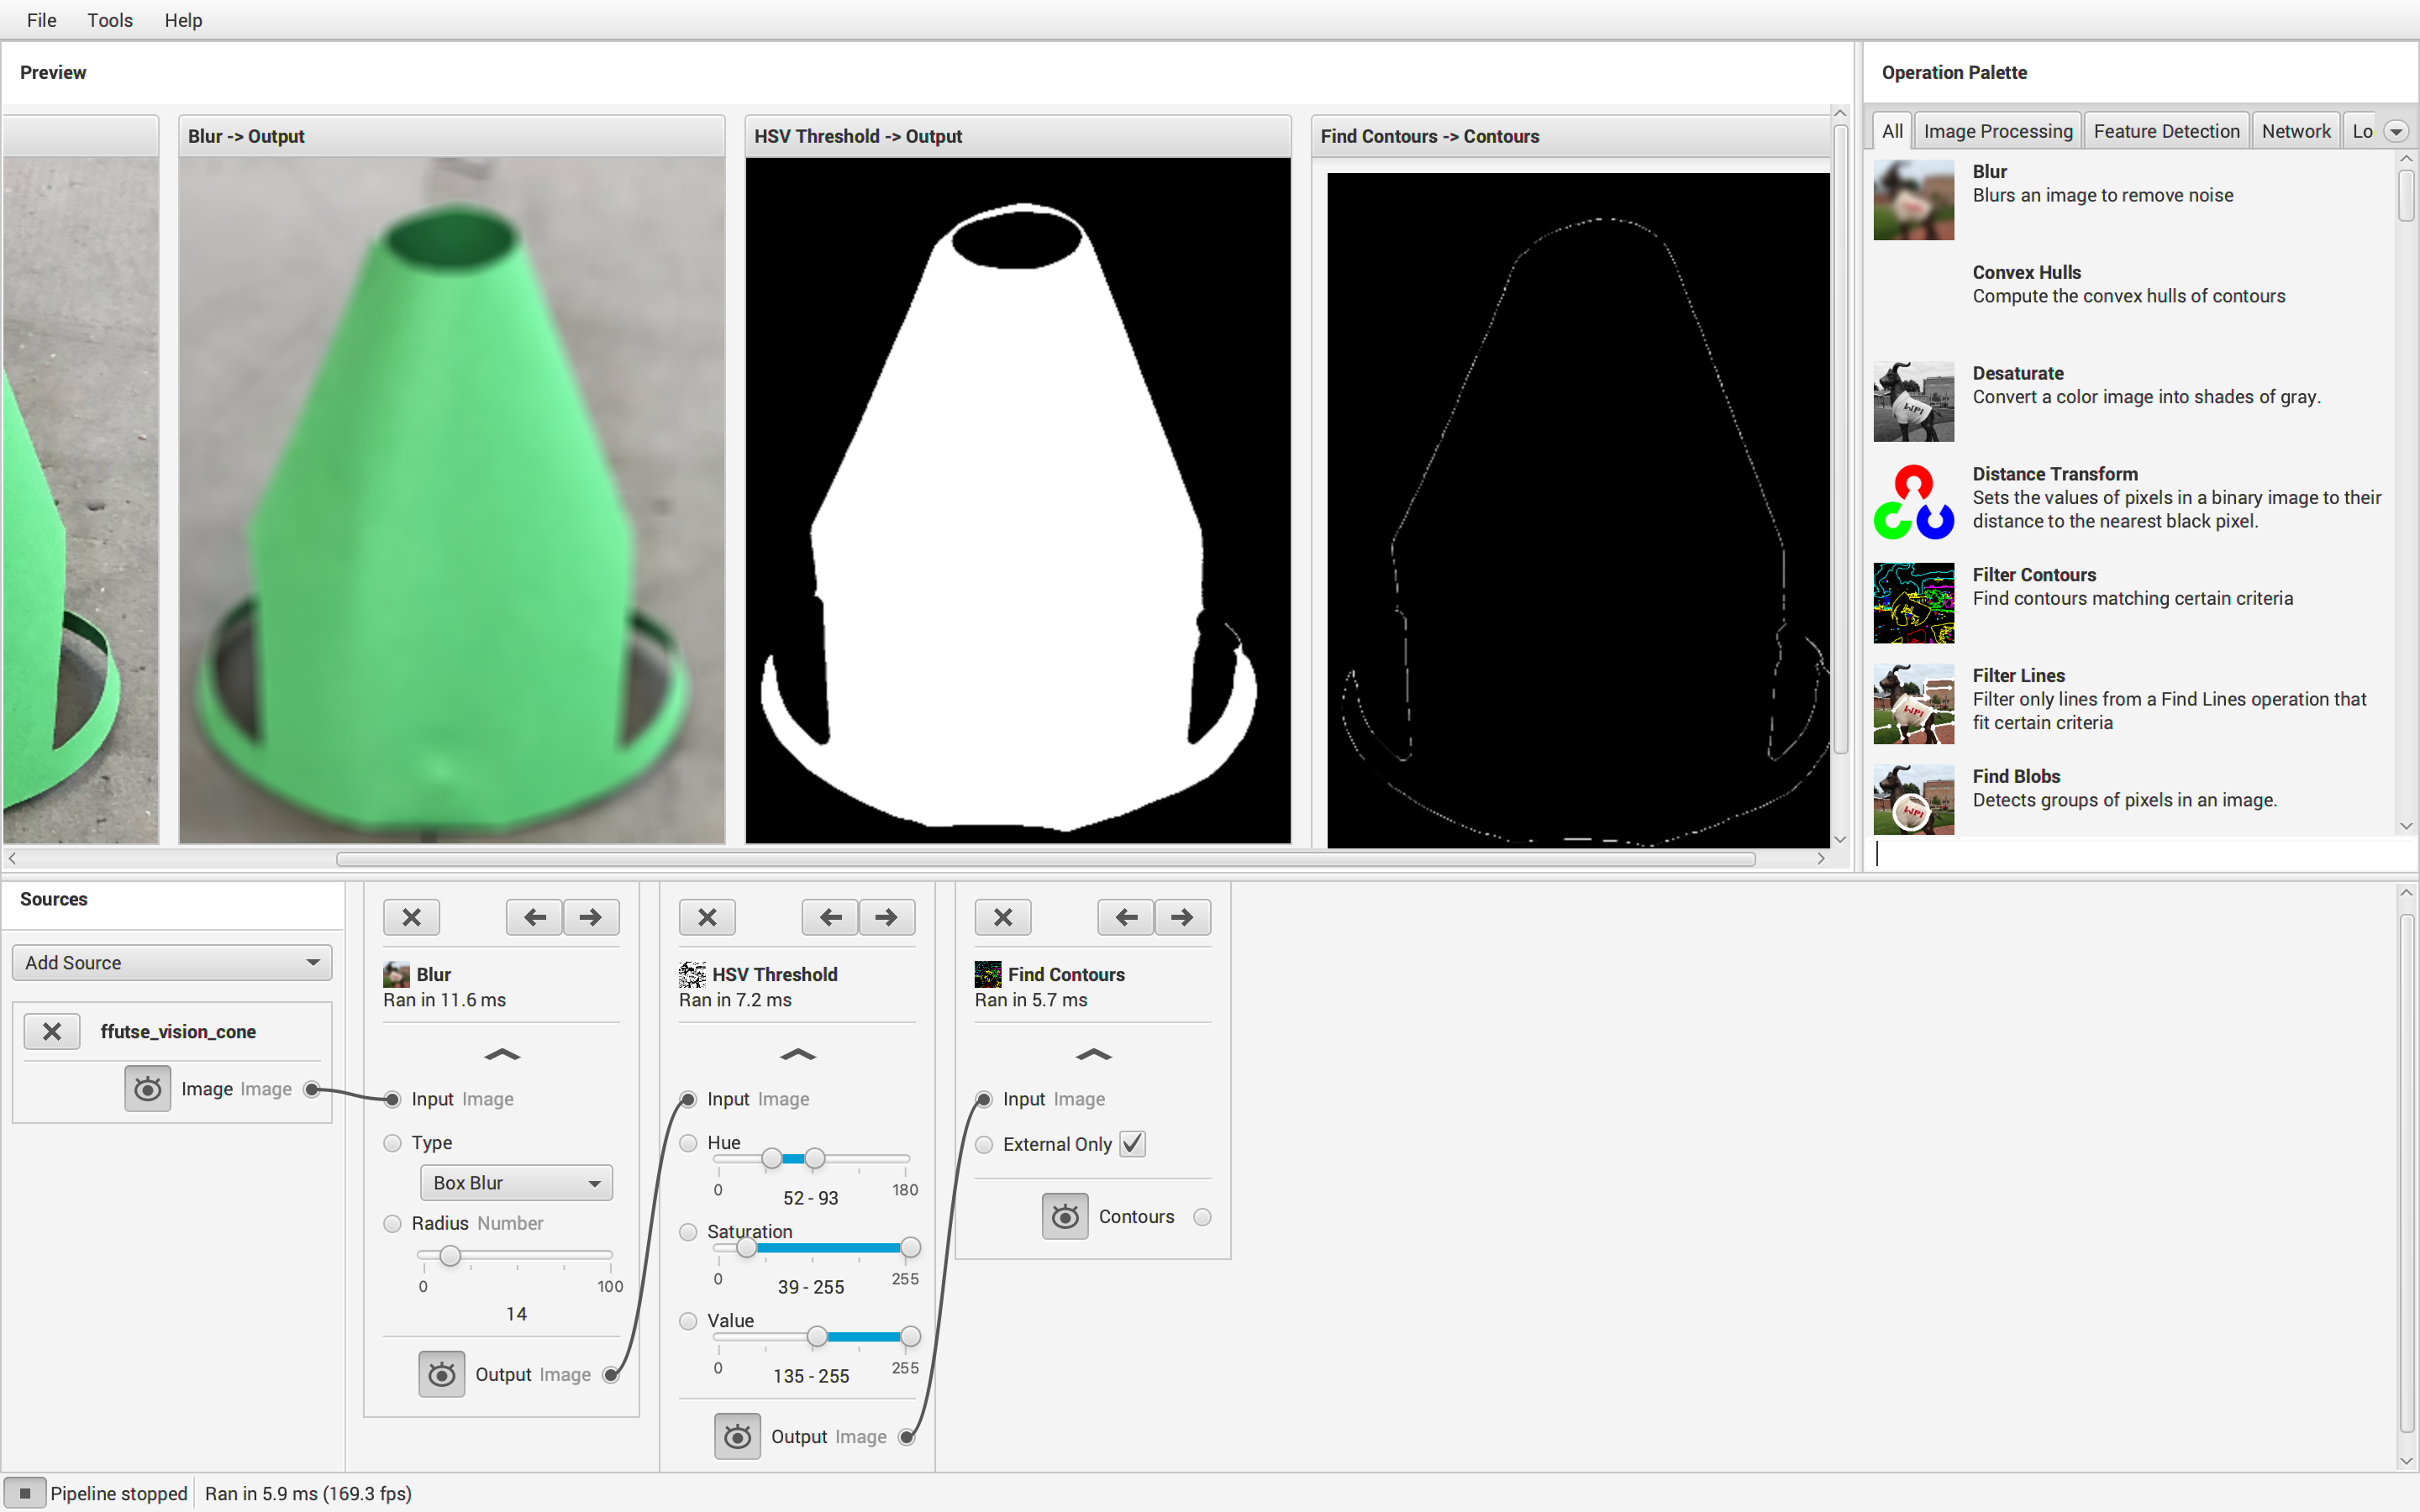
The final constructed GRIP pipeline is shown above. It follows the steps:
- gaussian/box blur
- HSV threshold
- contour detection

However, multiple contours/color blobs may be detected in the last step shown in the GRIP pipeline, so the largest contour must be selected by area. From this largest contour, moments can be used to find the (x, y) coordinate of the contour's centroid. Moments are defined as the weighted sums of pixel intensities (pixel values when converted to grayscale), weighted by their x and y positions to produce m_1_0 and m_0_1 respectively. These moments can then be divided by m_0_0 to produce the x,y coordinate of the centroid of the largest detected contour, the final desired result.
Finally, the completed vision pipeline was exported to java and modified to be compatible with EasyOpenCV, as well as select the largest contour by area and compute its centroid.
Next Steps:
Possible next steps for other approaches of detecting FFUTSE cones include the shape-based approach and machine learning with tensorflow. The shape-based approach would use an adaptive threshold and contour detection to detect multiple contour, and can rely on the shape of the contour (tapered towards the top like a cone) to detect the location of the FFUTSE cone placed in the image.
In order to construct a tensorflow model to detect FFUTSE cones, training data (images of FFUTSE cones placed in various different orientations, lightings, and backgrounds) will need to be collected and labelled with the (x, y) coordinate of the FFUTSE cone in each image. Then, a CNN (Convolutional Neural Network) can be constructed, trained, and exported as a .tflite file to be used in the FTC ecosystem.